
Nepal's Economic & Investment Profile
A comprehensive overview of Nepal's macroeconomic indicators, demographic strengths, and investment fundamentals — sourced from the World Bank, NRB, UNCTAD, and the United Nations.
$45.84B
GDP 2023
3.9%
Growth Rate
30.9M
Population
83,000 MW
Hydro Potential
Why Invest in Nepal?
Nepal offers a unique investment destination at the crossroads of Asia's two largest economies, India and China, providing strategic access to rapidly growing regional markets. The country is rich in natural resources, including immense hydropower potential, world-renowned tourism assets, and fertile agricultural land, creating opportunities across multiple high-growth sectors. A young, competitive workforce and cost-effective labor market further enhance business potential. Backed by investor-friendly policies including 100% foreign ownership in many industries, guaranteed profit repatriation, and strong legal protections for foreign investors, Nepal provides a stable and promising environment for sustainable, long-term investment.
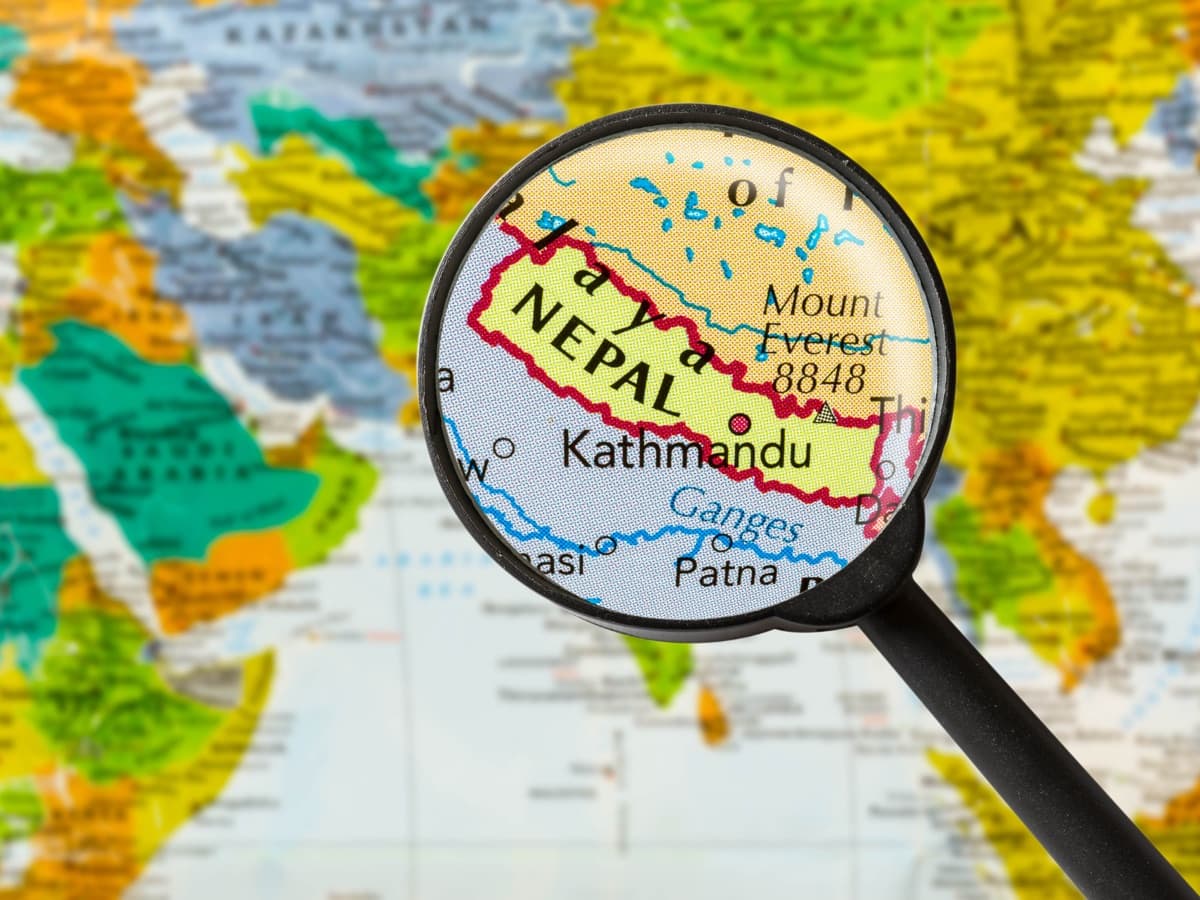
Strategic Location
Land-Linked Country
Serves as a natural bridge for trade and connectivity between the two most populous countries, India and China.
Regional Connectivity Projects
Ongoing infrastructure projects (e.g., highways, railways, dry ports) enhance trade prospects across South Asia.
Market Access
Nepal's strategic location offers convenient market access to neighboring countries, significantly enhancing its attractiveness for foreign investment.
Population Dividend
Nepal's median age is 24 — one of the youngest populations in Asia
95+
90-94
85-89
80-84
75-79
70-74
65-69
60-64
55-59
50-54
45-49
40-44
35-39
30-34
25-29
20-24
15-19
10-14
05-09
00-04
Male %
Female %
30.9M
Total Population
64%
Working Age (15–64)
~24 yrs
Median Age
- Growing English-literate technical & professional workforce
- Returnee diaspora bringing global skills and capital
- Government TVET programmes expanding skilled labour supply
- 71.2% literacy rate with upward trend (UNESCO 2021)
Financial Advantages
Nepal's investment framework under FITTA 2019 is designed to attract and retain foreign capital — from first entry through to profit repatriation
Before / During Investment
Low Entry Barriers
Minimum FDI threshold reduced to NPR 20 million, with no minimum for ICT-based industries under the Automatic Route.
No Upper Limit
There is no upper limit on the amount of investment a foreign investor can make.
Full Ownership
100% foreign ownership is allowed in many sectors, giving investors full financial control.
Simplified Approval
The Automatic Route allows faster entry without prior Department of Industry approval for projects up to NPR 500 million.
One-Stop Facilitation
The One-Stop Service Centre (OSSC) centralizes Inland Revenue, Customs, and NRB to streamline registration.
After Investment
Repatriation Rights
Legal right to repatriate profits, capital, and dividends — including royalties from technology transfers and loan interest/principal.
Corporate Income Tax
General rate of 25%, reduced to 20% for priority sectors — Energy, Transport Infrastructure, and Manufacturing.
Tax Holidays
Available for prioritized sectors such as hydropower, tourism, agriculture, and manufacturing.
Customs Exemptions
Customs exemptions are provided in prioritized sectors.
Cash Incentives
Cash incentives are available specifically for exports.
Legal Protections
A formal guarantee against expropriation ensures foreign-invested industries will not be nationalized.
Forex Facilitation
A dedicated One Stop Service Center(OSCC) unit facilitates currency exchange and remittance of earnings, principal, and interest.
International Agreements
Treaty protections and multilateral memberships that de-risk foreign investment in Nepal
Investment Protection Treaties
Bilateral Investment Promotion & Protection Agreements (BIPPA)
6 CountriesProvide legal guarantees on fair treatment, protection from expropriation, free transfer of funds, and access to international dispute resolution.
France
Since 1983
Germany
Since 1986
United Kingdom
Since 1993
Mauritius
Since 1999
Finland
Since 2009
India
Since 2011
Double Taxation Avoidance Agreements (DTAA)
10 CountriesPrevent businesses and individuals from being taxed twice on the same income across borders — reducing the effective tax burden for cross-border investors and their Nepal-based operations.
International Memberships

UN — United Nations
Strengthens international cooperation, sustainable development, and investor confidence through global partnerships.

UNCTAD — UN Conference on Trade and Development
Trade and investment policy support and FDI facilitation.

SAARC — South Asian Association for Regional Cooperation
Regional trade facilitation and policy alignment across South Asia.

MIGA — Multilateral Investment Guarantee Agency (World Bank Group)
Political risk insurance and investment guarantees for foreign investors.

BIMSTEC — Bay of Bengal Initiative for Multi-Sectoral Technical and Economic Cooperation
Connectivity and economic integration between South and Southeast Asia.

WTO — World Trade Organization
Most Favoured Nation (MFN) and preferential GSP trade access to 164 member countries.
BRI — Belt and Road Initiative (China)
Strategic infrastructure connectivity linking Nepal to the Trans-Himalayan corridor.
Key Economic Indicators
Macroeconomic data highlighting Nepal's financial scale, growth momentum, and capital flows relevant for investment decisions.
GDP (Nominal)
$45.84B
Source: Nepal Rastra Bank(NRB)
GDP Growth
3.9%
Source: World Bank
Population
30.9M
Source: Nepal Statistics Office
Per Capita GDP
$1,536
Source: Nepal Rastra Bank
Purchasing Power Parity(PPP)
$6,500
Source: International Monetary Fund(IMF)
FDI Inflows
$180M
Source: UNCTAD / NRB
Remittances
$14.59B
Source: World Bank
Sectoral Contribution to GDP
Nepal's economy is predominantly services-driven, with a significant agriculture base and a growing industrial sector. Tourism, remittance-driven retail, and finance lead the services segment.
100%
of GDP
Source: Central Bureau of Statistics, Nepal (2022-23)
Tourism Revenue
$800M+
International tourist receipts, 2023
Agriculture Exports
$480M
Tea, spices, cardamom, pashmina
IT/BPO Revenue
$400M
Fast-growing digital services sector
Hydro Generation
2,800 MW
Installed capacity; 43,000 MW feasible
Resilient Recovery After Pandemic
Nepal's GDP growth contracted in FY2020 due to COVID-19 but recovered strongly in FY2022 at 5.8%. The economy is on a positive trajectory at 3.9% in FY2024.
Source: World Bank, Nepal Fiscal Years
FDI Inflows in USD Millions — Source: UNCTAD / Nepal Rastra Bank
FDI Inflows Trending Upward
After a dip in 2021 during global uncertainty, FDI into Nepal has rebounded to an estimated $180 million in 2023. Policy reforms under the Foreign Investment and Technology Transfer Act (FITTA 2019) are driving increased confidence.
One-stop approval via ICAN
100% FDI permitted in most sectors
Profit repatriation guaranteed
Tax holidays up to 10 years in priority sectors
Natural Resources & Strategic Assets
Nepal is endowed with vast renewable energy potential, rich biodiversity, and iconic geography that underpins tourism, agriculture, and energy-sector investments.
Hydropower Potential
83,000 MW
Theoretical potential; 43,000 MW economically feasible
~2,800 MW installed
Forest Cover
44.7%
Percent of total land area under forest
5.96 million hectares
Arable Land
17%
Of total land; diverse climate zones across altitude bands
Terai, Hills, Mountain
Tourism Assets
8 of Top 10
Eight of the world's ten highest mountain peaks
1.1M visitors in 2023
Hydropower Development Progress
Installed capacity vs. economically feasible potential (43,000 MW)
Only 6.5% developed — massive runway ahead
Source: Water and Energy Commission Secretariat (WECS), Nepal
Growth Drivers & Projections
The IMF and World Bank project Nepal's GDP growth to accelerate toward 5–6% in the medium term, driven by energy exports, expanding tourism, and structural reforms.
Energy
5–6% CAGR
2024–2030
- Cross-border power export to India
- Growing domestic demand
- International project financing
Tourism
8–10% growth
per annum
- Post-pandemic rebound
- 'Visit Nepal' campaigns
- Infrastructure upgrades
IT & Digital
15–20% CAGR
2024–2028
- Young tech-skilled population
- Government digital agenda
- Growing BPO/outsourcing market
Agriculture
3–4% CAGR
2024–2030
- Agro-processing and value addition
- Organic certification trend
- Export market diversification
Manufacturing
6–8% CAGR
2024–2030
- SEZ development
- China+1 supply chain shift
- Competitive labour costs
Financial Services
10–12% CAGR
2024–2028
- Financial inclusion expansion
- Fintech growth
- NRB regulatory modernisation
Projections based on IMF World Economic Outlook, World Bank Country Reports, and Nepal Planning Commission estimates.